How to Stress Test a Linux System
Ever wonder the best way of stress testing a Linux system? I recently built a new machine, and one of the first things I do with new builds is a good ol’ fashioned stress test. But what are the best methods for stress testing a Linux box? This post will give you everything you need to stress test the CPU, GPU, disk, memory, and network on your Linux system!
Why Stress Test Linux?
One of the first questions I often here is “Andy, why would I want to stress test my machine?”
Well, there are a litany of reasons why you may want to do this. While some types of stress tests are more common in the enterprise space than in personal computing, stress testing a system is a useful way to evaluate its performance and stability under highly demanding conditions. This insures that the system will function as designed, even when under heavy use. Here are some reasons why you might want to do it:
-
Ensure System Stability: For example - if you’re overclocking your CPU or GPU, stress testing helps confirm that your system can handle the increased workload without crashing or becoming unstable.
-
Thermal Management: Stress testing can (and is designed) to push components to their limits, which helps identify if your cooling system is adequate to handle peak performance or if adjustments are needed to prevent overheating.
-
Hardware Diagnostics: Stress testing can reveal underlying issues in hardware like faulty memory, a failing power supply, or other components that might not show problems during regular use.
-
Benchmarking Performance: If you’re comparing your system’s performance to others or want to measure the impact of hardware upgrades, stress tests provide a standardized way to do that.
-
Optimizing Resource Usage: For gamers, content creators, or professionals running demanding applications, stress testing ensures the system is optimized for maximum performance and is functioning as designed for those use cases.
-
Preemptive Maintenance: Regular stress testing can help identify potential weak points in your system early, giving you a chance to address issues before they lead to failures. For example, you may do this regularly to verify cooling systems continue to run optimally, even after a period of time.
-
Testing for Extreme Use Cases: For specific tasks like rendering, simulations, or running resource-intensive software, stress tests ensure that your system can handle prolonged workloads effectively, and that power systems, and cooling are properly configured to support the system under those conditions.
Stress Testing and Monitoring Tools for Linux
When it comes to stress testing and monitoring CPU, memory and storage, we’ll be using some of the same tools, starting with htop, lm-sensors, and stress-ng. Component specific tools (like those for GPUs) will be discussed in-line further below in this article.
htop
Stress testing without monitoring typically isn’t helpful unless your sole goal is testing the reliability of a system under load over a period of time. With that in mind we need some monitoring tools to monitor hardware during stress testing. The first of these will be htop
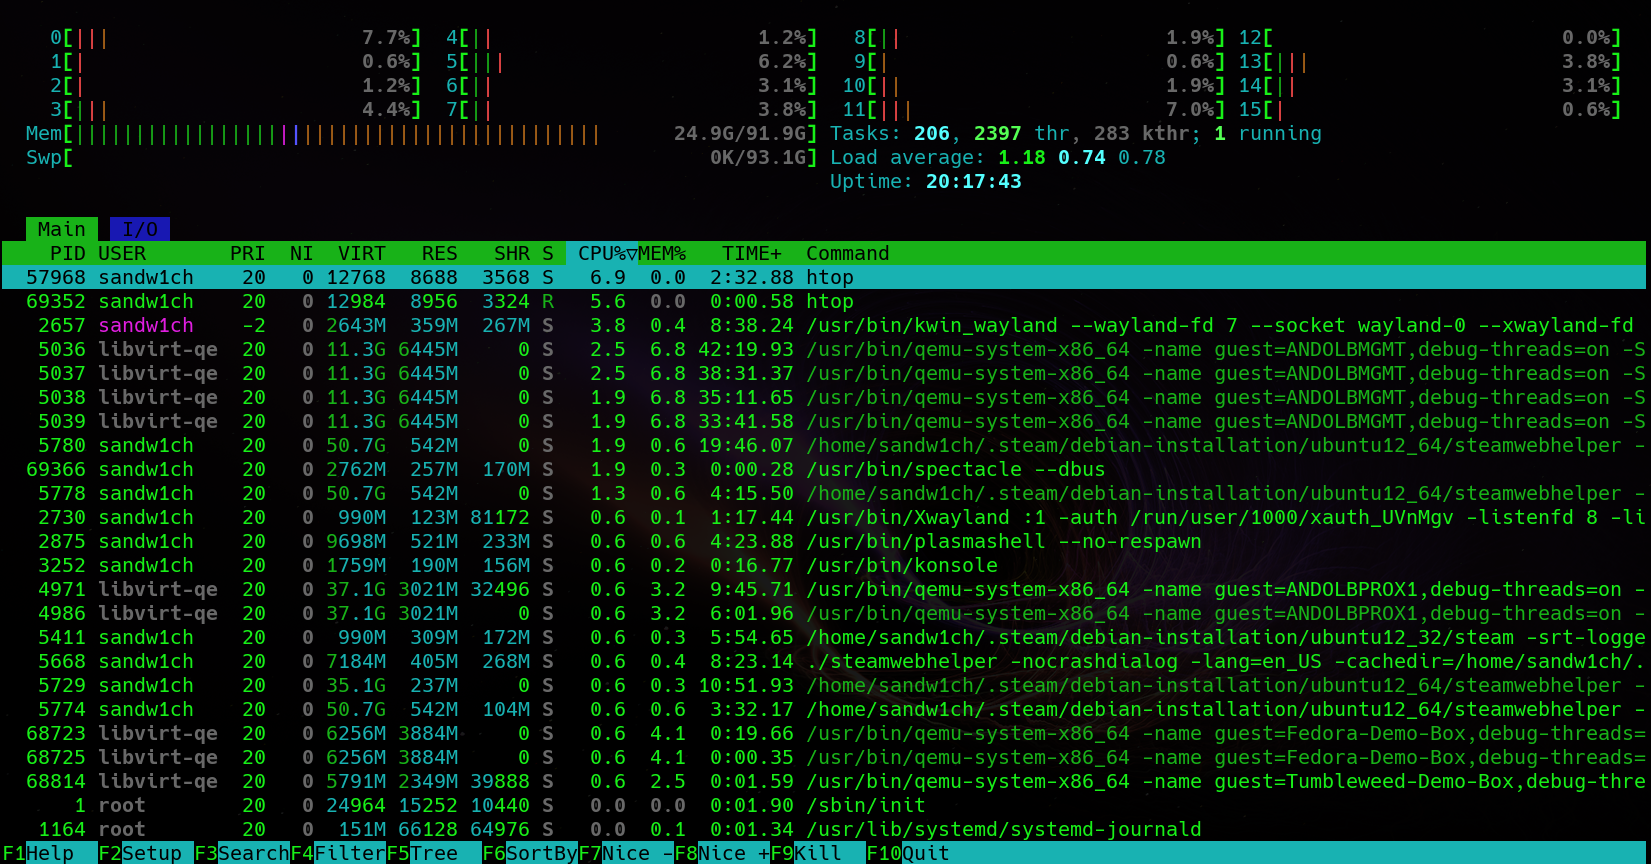
htop is a variation of the long standing open source tool top (table of processes). htop provides the same information but in a more visual way that is easier to interpret. You can install htop via the package manager on most linux systems:
Debian-based distributions (Debian, Ubuntu, Mint….etc)
sudo apt install htop
Fedora
sudo dnf install htop
OpenSUSE
sudo zypper install htop
The application can be run by simply running the below command in your favorite terminal emulator:
htop
lm-sensors
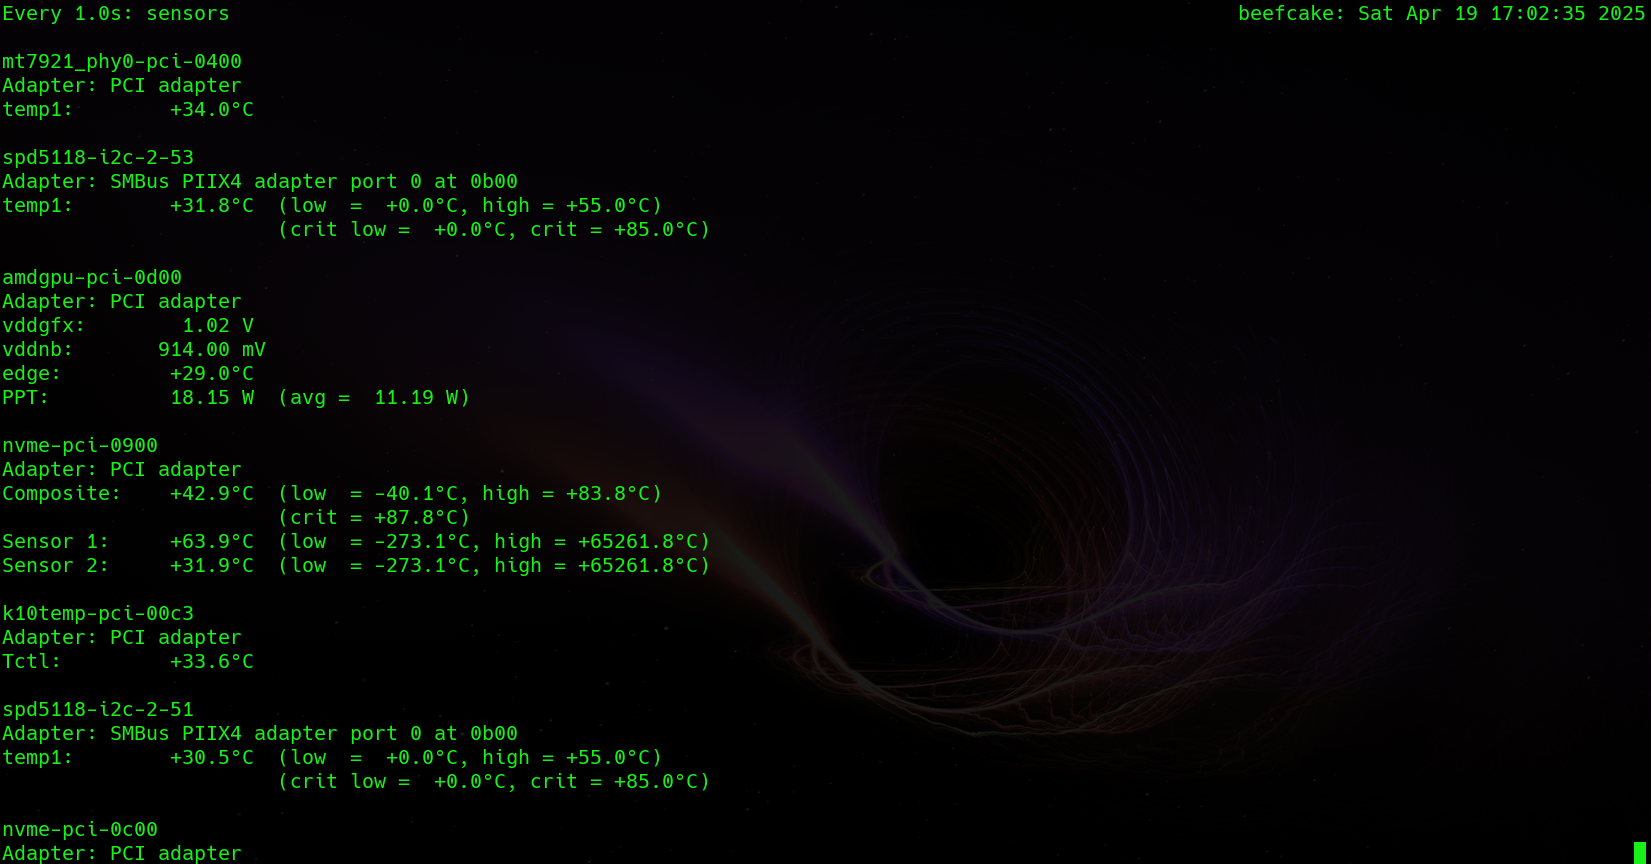
Many times during stress testing a key data point is hardware thermal temperature. lm-sensors provides an easy to use cli application that operates in userspace that pulls hardware info (including thermal info!) from the running Linux kernel.
Most major distributions come with lm-sensors installed, but in case yours does not:
Debian-based distributions (Debian, Ubuntu, Mint….etc)
sudo apt install lm-sensors
Fedora
sudo dnf install lm_sensors
OpenSUSE
sudo zypper install sensors
lm-sensors can provide a one time snapshot of the current sensor state by running:
sensors
This isn’t all that useful for stress test monitoring however. You can pair this with the “watch” command to get regular updates. For example if you wanted the sensors output to update every 1 second, you would run the below:
watch -n 1 sensors
stress-ng
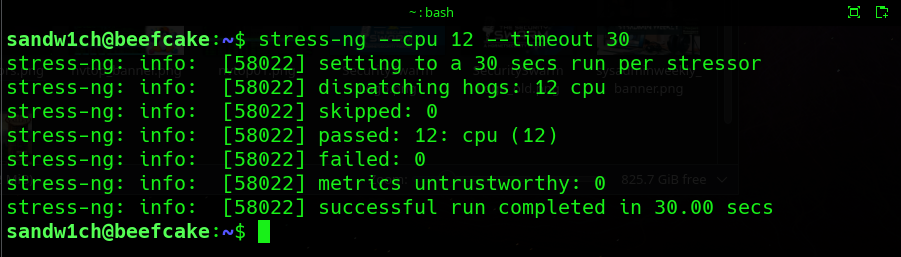
The utilities we’ve discussed thus far in this article have been monitoring tools. stress-ng will be the tool that actually puts load / stress onto the various components of the target system.
stress-ng allows you to put load onto CPU, memory, and storage. For example, output of a CPU test is shown in the image below:
stress-ng can be installed with the package manager in most major distributions:
Debian-based distributions (Debian, Ubuntu, Mint….etc)
sudo apt install stress-ng
Fedora
sudo dnf install stress-ng
OpenSUSE
sudo zypper install stress-ng
With stress-ng installed, the syntax is different depending on which components you’re looking to put load onto. We’ll cover said syntax for stress-ng in the below sections.
How to Stress Test a CPU on Linux
Stress testing the cpu using stress-ng is quite simple. You’ll need to pass the –cpu parameter in order to tell stress-ng that we’re targeting the CPU. For example, if you wanted to stress test all CPU cores for a period of 60 seconds you would use the below command:
stress-ng –cpu 0 –timeout 60
The “–cpu 0” parameter tells stress-ng to choose ALL cpu cores for the test. That said if you wanted to only put stress on 4 cores, you could switch that to “–cpu 4” instead. For an idea of what the CLI output for stress-ng looks like, please see the image further up in this post.
Note: Once stress-ng is running, you can use htop and sensors to monitor the CPU usage and corresponding CPU temperature as well during the test.
How to Stress Test Memory on Linux
Memory can also be tested with stress-ng. You can denote the number of “workers” as well as the amount of memory that each worker should consume. Once defined stress-ng will continuously allocate and reallocate the defined amount of memory for the defined amount of time.
For example, if you had 64 GB of memory, your OS is consuming 4 and you wanted to test the remaining 60, you could use the below command to stress the amount of memory that is not in use by the OS (60GB in this case) for 2 minutes:
stress-ng –vm 1 –vm-bytes 60G –timeout 120
The “–vm 1” parameter tells stress-ng that there will be one worker process allocating the memory. The “–vm-bytes 60G” denotes that said worker process should allocate and use 60GB of memory. Again, the “–timeout 120” is the parameter that defines how long the test should last. 120 seconds in this case, or 2 minutes.
How to Stress Test Storage on Linux
Storage stress testing is typically reserved for more enterprise-centric storage systems like SANs and NASs, but there are applications outside of the enterprise as well. Maybe you’re troubleshooting the health of flash storage, or maybe you’re optimzing storage for database workloads. Whatever your specific use case, the tools needed to test I/O (inputs/outputs) or IOPS (Input / Output Operations per second) are present in most Linux distributions.
While we can use stress-ng to put load on system storage, we’ll need a different tool to monitor storage performance. The recommended tool for this is iostat.
What is iostat?
iostat is a command line utility that is used to measure the performance of storage operations on a linux system. On most distributions the iostat command is contained within a package containing multiple system tools. For example, on Debian, Fedora, and OpenSUSE iostat is included in the “sysstat” package. It’s easily installed on most systems using the native package manager:
Debian-based distributions (Debian, Ubuntu, Mint….etc)
sudo apt install sysstat
Fedora
sudo dnf install sysstat
OpenSUSE
sudo zypper install sysstat
Once installed, you can start continuous monitoring by using the below command:
iostat 1
Now this will display the storage performance for all storage devices / mount points on the system. If you have a lot of these, it may be too much info. The nice this is you can get more granular. For example, I have a specific device set aside for my /home directory. You can target a specific device for monitoring using the -p parameter as shown below:
iostat -p /dev/devicename 1
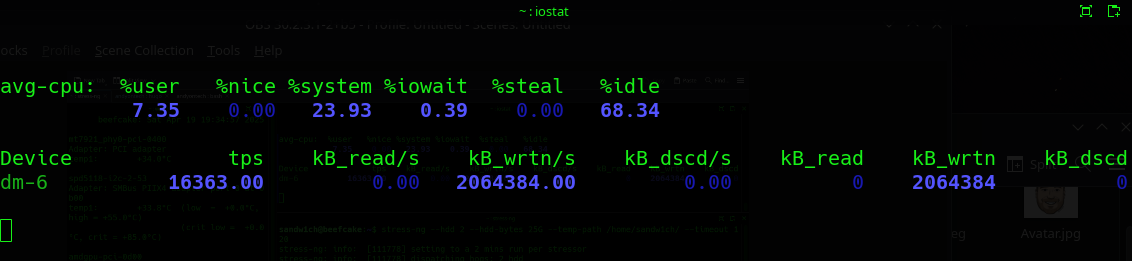
For a tangible example of what this looks like - in the below image iostat is showing the given device achieving roughly 16k TPS (transactions per second). In iostat, TPS = IOPS. So, it’s a good indicator of overall storage performance on the given device.
Stress Testing Linux Storage Using stress-ng
With iostat running in it’s own CLI window you now have proper storage monitoring in place. stress-ng can be called to put load onto the target storage at this point. While there are several options for running storage tests with stress-ng, i’ve found the simplest way is to use the –temp-path parameter to define the operation to a directory living on the storage system or device I want to test specifically.
For example:
stress-ng –hdd 2 –hdd-bytes 25G –temp-path /home/sandw1ch/ –timeout 120
The above command:
- runs two storage stress workers (denoted by the “–hdd 2” parameter)
- each worker continuously writes 25GB of data (denoted by the “–hdd-bytes 25GB” parameter)
- Uses my home directory as the location to use for the test (denoted by the –temp-path parameter)
- runs for 120 seconds
These parameters with stress-ng should cover the vast majority of storage stress testing use cases, but if you need more info on the various storage testing options inn stress-ng, I highly recommend giving the man page a read via the “man stress-ng” command.
How to Stress Test a GPU on Linux
With the popularity of AI, GPU performance is becoming even more important than it already was. It used to be that GPU performance was typically only looked at in terms of gaming, or professional graphics workloads like CAD or video editing. Now though, the bulk of AI processing around the world happens via GPU. That all said, we have ample tools at our disposal in any Linux environment to push GPUs to the limit.
In this post we’re going to look at two things:
- How to use NVTOP to monitor GPU performance
- How to use UNIGINE or Ollama to put load on a GPU
How to Use NVTOP to Monitor GPU Performance
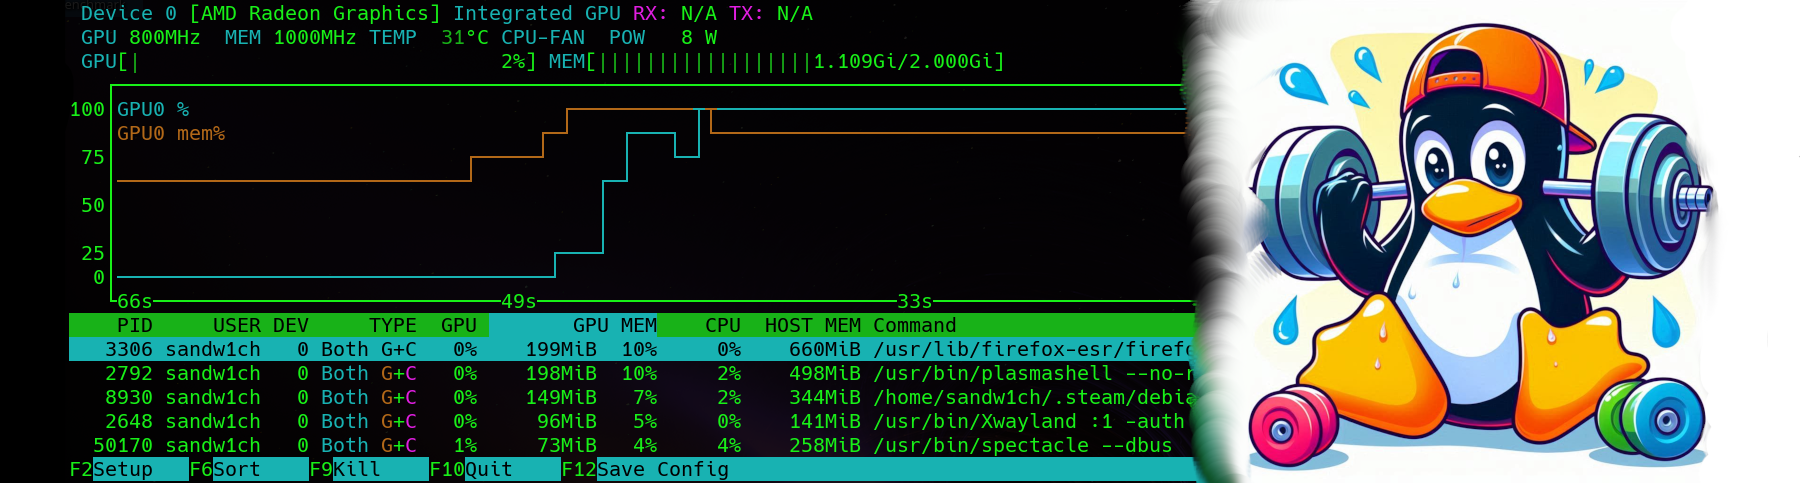
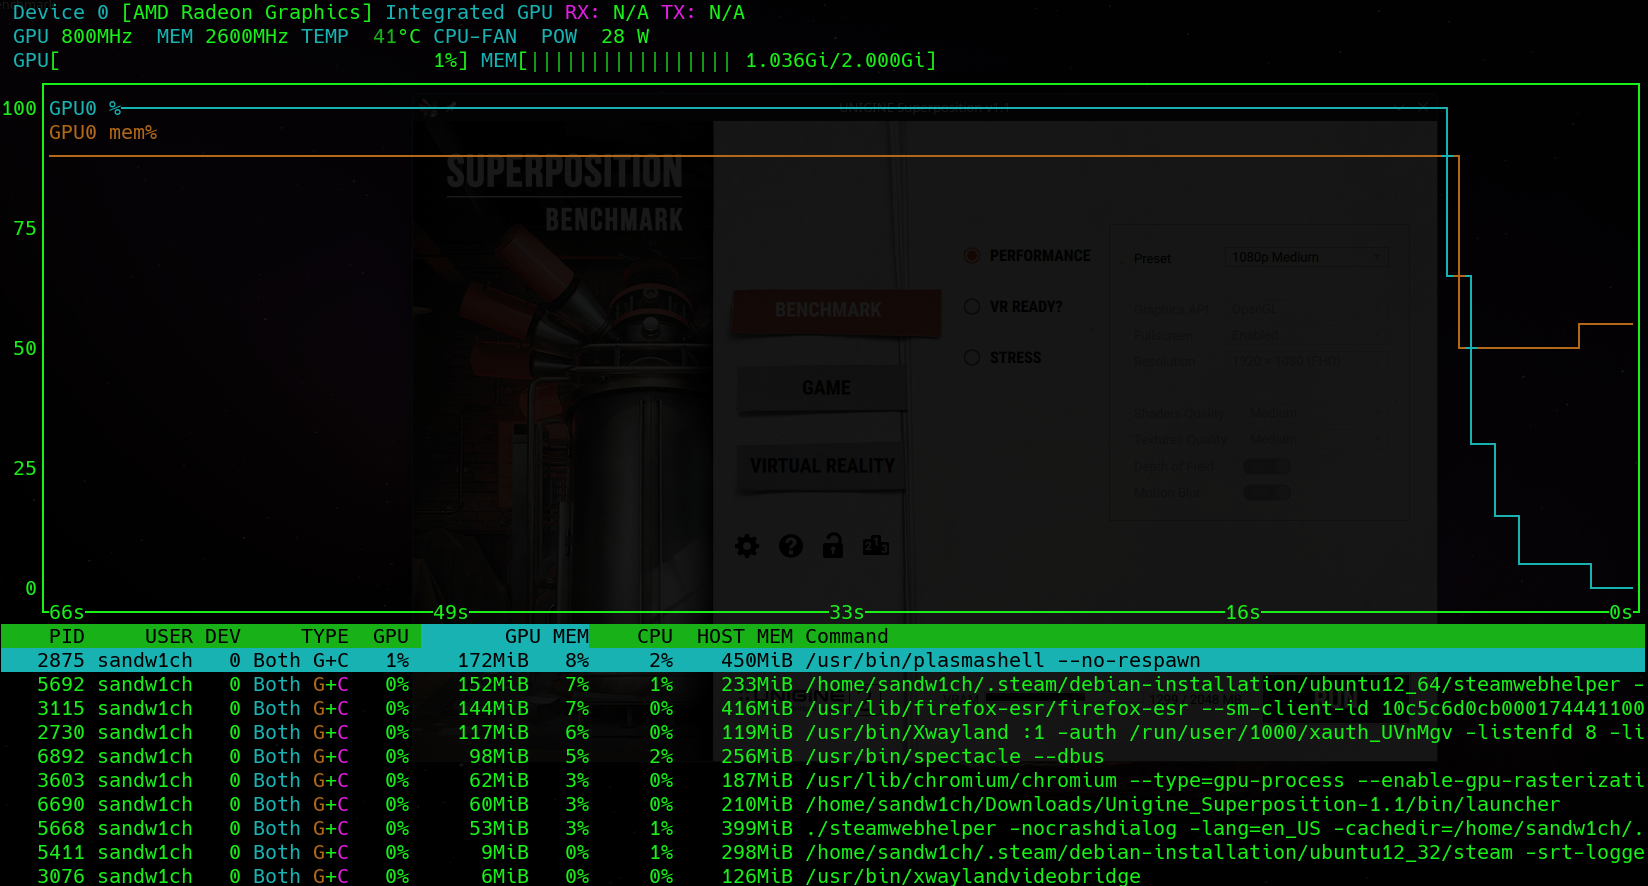
As mentioned, stress testing without measurement isn’t all that useful unless you are strictly testing stability under heavy load. For monitoring of GPU performance my preferred tool is nvtop or Neat Videocard TOP (shown below).
How to Install nvtop
Depending on your distribution, you can install nvtop using one of the below commands:
For Debian-Based distributions (Debian, Ubuntu, Mint…etc)
sudo apt install nvtop
For Fedora
sudo dnf install nvtop
For OpenSUSE
sudo zypper install nvtop
Launching and Using nvtop
Things are simple at this point. Simply open a CLI and run:
nvtop
The utility should automagically detect your video device and give you a number of useful statistics such as:
- GPU Usage
- GPU Memory
- Temperature
- Running Processes and GPU Utilization
You’ll want to let nvtop continue to run for now. The next step is to put the GPU under load.
How to Use UNIGINE to Stress Test a GPU
Now you could use just about any application that leverages the GPU to test GPU performance. However, I’ve found that the GPU benchmarking tools from UNIGINE work very well. The free versions allow you to run a variation of graphical rendering to put load on your GPU, while the paid version allows you to dedicated stress tests. There is a Linux version as well, which is a plus! That all said, I’ve never found a need for the paid version as the free version allows you to set the test settings so high that it will put significant load on all but the moment extreme builds.
On the benchmarking page you’ll have the option of several benchmarking downloads (you may have to scroll down!). You can choose from Superposition, Valley, and Heaven. My personal favorite is Superposition. Make your choice and download the app.
Once downloaded you must adjust the file permissions to allow execution. As I always air on the side of caution, I would recommend you scan the file with an AV application such as ClamAV (yes…even on Linux), or use a service like VirusTotal. Maybe it’s because I work in the cybersecurity industry, but I NEVER implicitly trust any download, even if it’s suggested it is safe on a blog like this one!
Once you trust the file, you’ll want to make it executable as shown below (I downloaded the valley GPU testing application from UNIGINE in this example)
chmod +x Unigine_Valley-1.0.run
Now with the file executable you can launch it using:
./Unigine_Valley-1.0.run
This will extract the application into a sub-folder. Navigate to the folder and then run the core application file as shown below:
cd Unigine_Valley-1.0/ ./valley
This will launch the GPU benchmarking application and you’ll be able to select various options for graphics quality as shown below:
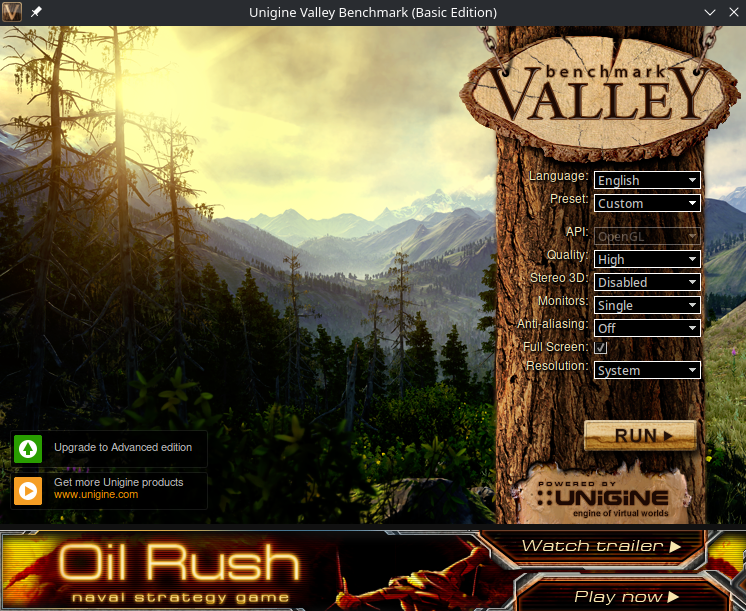
Choose your options and then select “run”. You can let the benchmark run for as long as you’d like prior to closing it. During that time, nvtop will continue to monitor your GPU usage and you can alt-tab during the benchmark, or check nvtop after you end the benchmark.
How to Stress Test the Network on Linux
Finally, the last core area that you may want to consider stress testing is the network. While this is a bit more rare, there may be situations where you want to test network throughput on a given device. Maybe you suspect that the device isn’t performing as well as it should, or perhaps you’re measuring how high the ceiling is in order to plan for future upgrades. Whatever the case, we have the tools to stress test the network portion of a system as well.
While there are many tools that can provide these testing capabilities for the network, iperf3 is likely the easiest to use. Like the others, iperf3 is easily installable via your distributions native package manager.
NOTE: the iperf3 package for OpenSUSE is simply name “iperf”
For Debian-Based distributions (Debian, Ubuntu, Mint…etc)
sudo apt install iperf3
For Fedora
sudo dnf install iperf3
For OpenSUSE
sudo zypper install iperf
You’ll need iperf on two different machines to test the network. You must define a “server” and a “client”. I use the machine i’m actively testing as the “client”. I then configure another system on the network as the “server” iperf is connecting too.
On the “server” you’ll run:
iperf3 -s
Then on the client side (the machine you’re actively stress testing)
iperf3 -c SERVERIPHERE
Example output shown below:
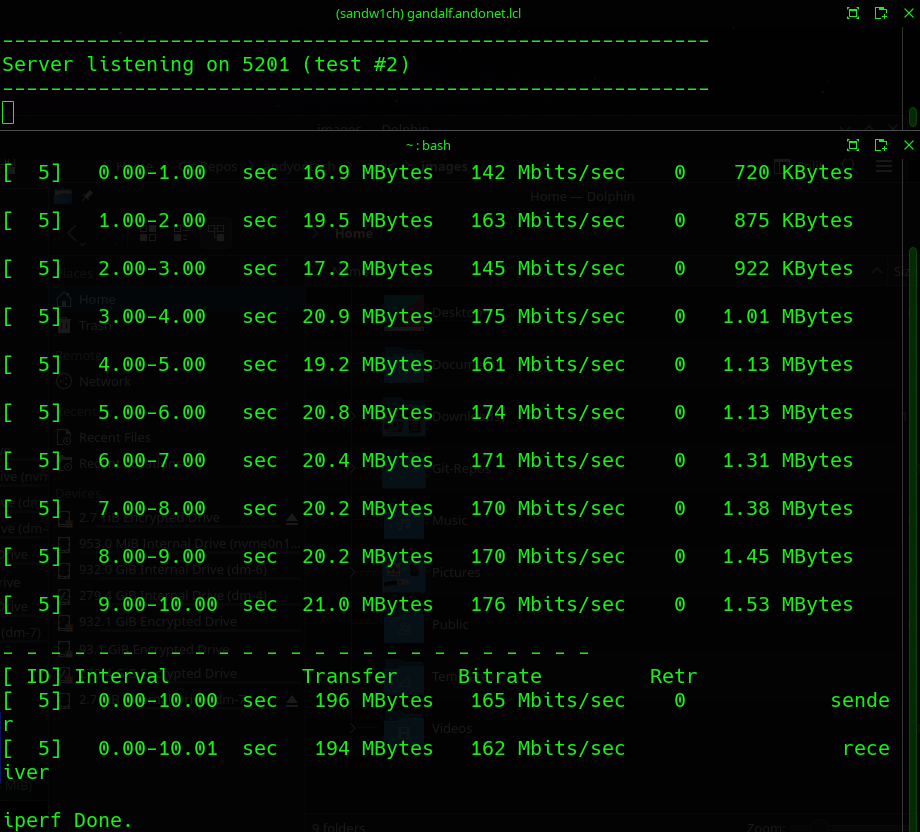
iperf does a good job of letting you know how the network is performing. If you suspect poor performance iperf can be used in iterative testing to determine what settings / changes are having a postive (or negative) impact on your network performance.
Wrap-Up
With all these tools at your disposal, you have everything you need to stress test all aspect of a Linux system. Whether you’re testing a new personal PC build at home or testing enterprise grade systems in the workplace, these tools will provide you with useful metrics to get the job done.
That said, if you do find yourself in the SysAdmin role for your day job, or you just have an interest in technology, I run a SysAdmin-focused podcast called SysAdmin weekly. This podcast is a podcast by SysAdmins FOR SysAdmins and can be found at any of the podcasting platforms below:
Also, for more written SysAdmin-centric content be sure to check out Project Runspace as well!
Thanks for reading and should you have any questions / comments on this content, be sure to check out the Contact Me page!